- 教育
- Stratégies de Trading
- Indicateur Aroon : suivre le cycle de vie d’une tendance
Indicateur Aroon : suivre le cycle de vie d’une tendance
Chaque mouvement du marché suit un rythme — début, accélération, puis ralentissement. L’indicateur Aroon aide les traders à comprendre à quelle étape de ce cycle se trouve une tendance. En mesurant quand le prix a formé son dernier plus haut ou plus bas, Aroon montre si la tendance gagne en force ou perd en momentum — souvent avant que cela ne soit évident sur le graphique.
- Ce que mesure l’indicateur Aroon
- Comment lire les données
- Comment les traders utilisent Aroon
- Forces et limites de l’indicateur Aroon
Ce que mesure l’indicateur Aroon
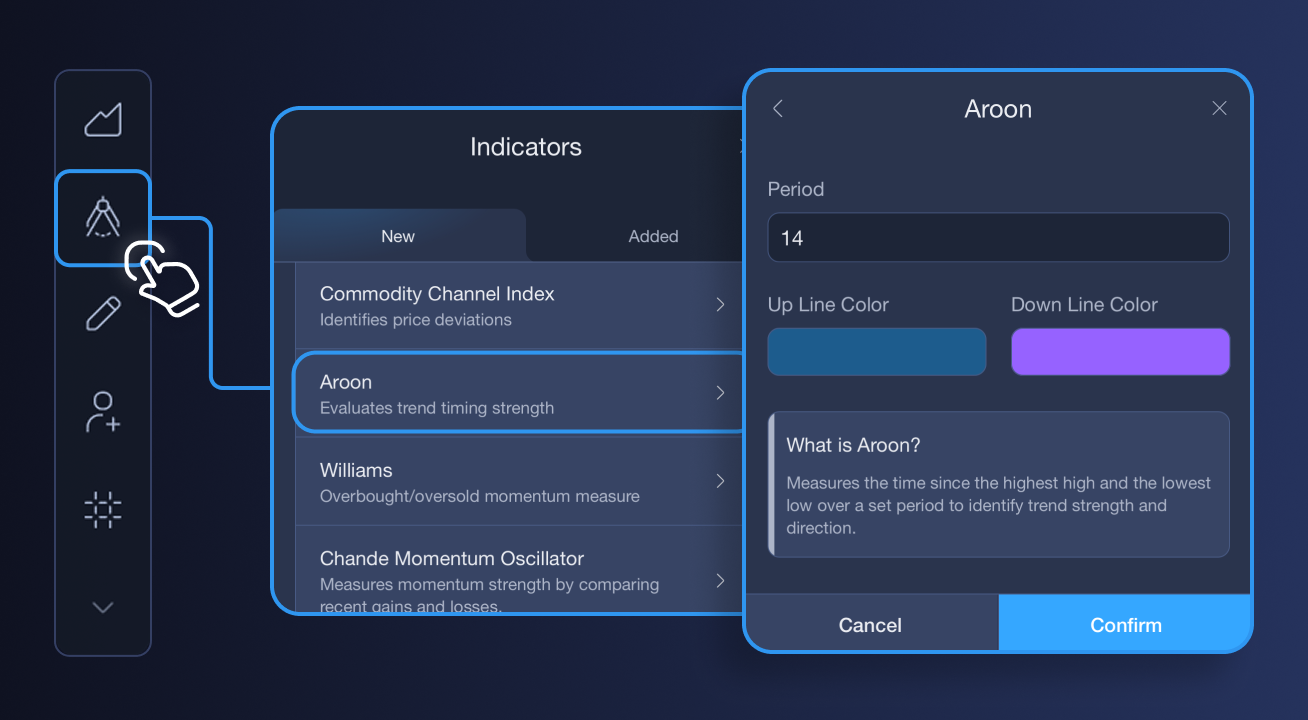
Aroon est composé de deux lignes évoluant entre 0 et 100 :
- Aroon Up : mesure le temps écoulé depuis le dernier plus haut.
- Aroon Down : mesure le temps écoulé depuis le dernier plus bas.
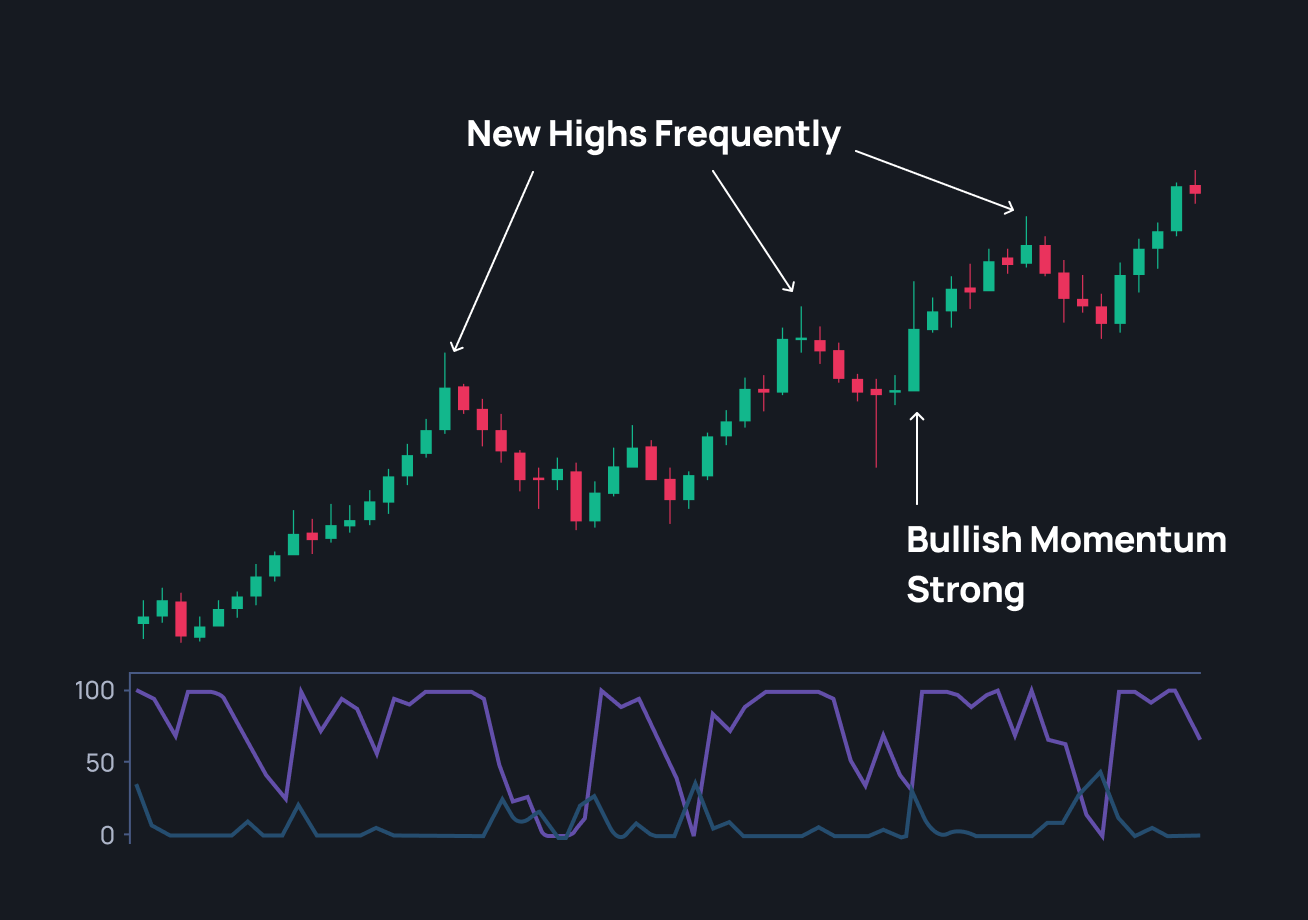
Lorsque Aroon Up reste proche de 100, le marché forme régulièrement de nouveaux sommets — signe d’un fort momentum haussier. Lorsque Aroon Down reste proche de 100, c’est l’inverse — les vendeurs dominent.
La relation entre ces deux lignes indique si le marché est en tendance, en perte de force ou en consolidation.
Comment lire les données
Comprendre l’interaction entre Aroon Up et Aroon Down est essentiel :
- Tendance haussière forte : Aroon Up proche de 100, Aroon Down proche de 0
- Tendance baissière forte : Aroon Down proche de 100, Aroon Up proche de 0
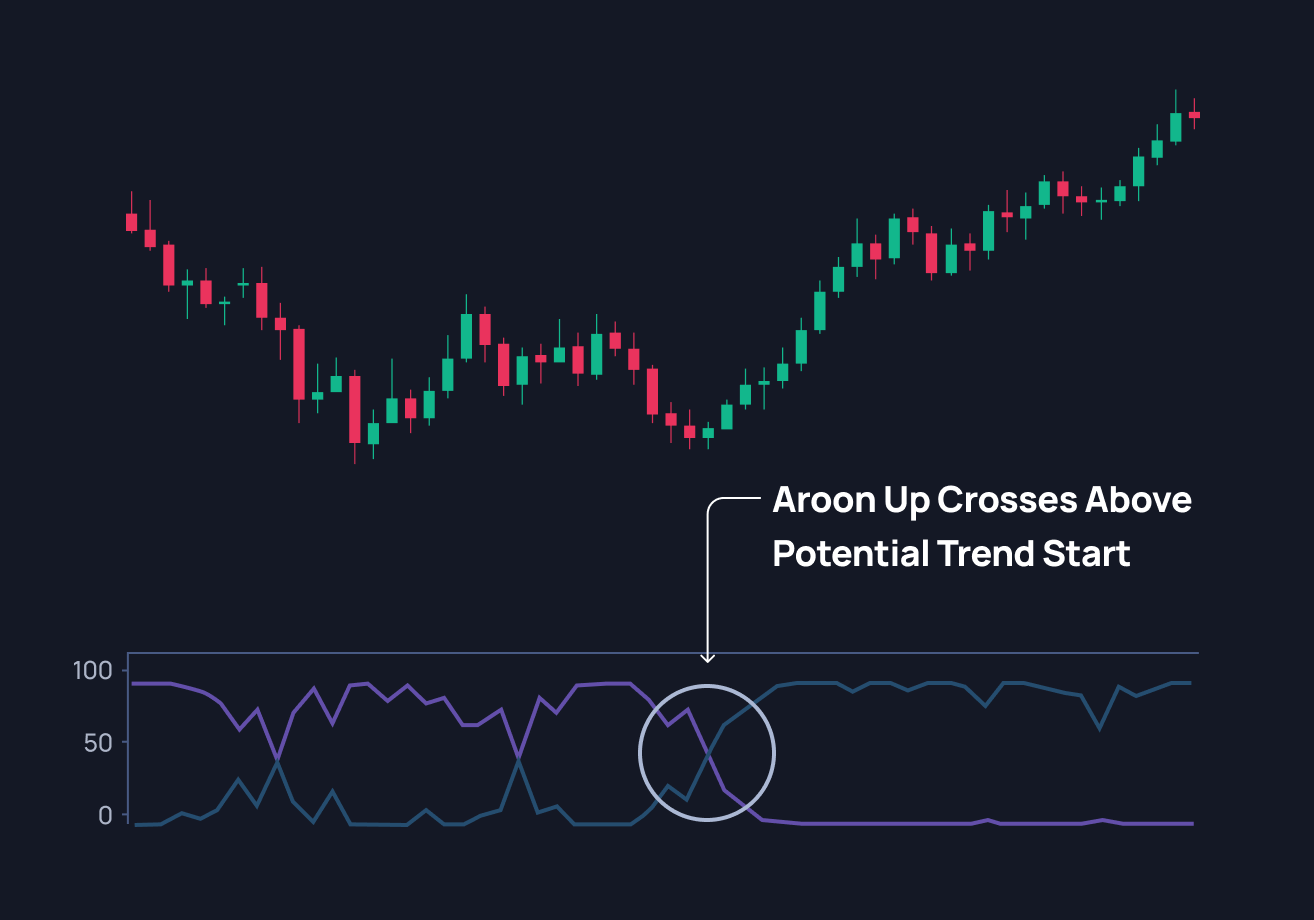
- Croisement : lorsque Aroon Up croise Aroon Down à la hausse, cela peut indiquer une nouvelle phase haussière. Le croisement inverse peut signaler un retournement baissier.
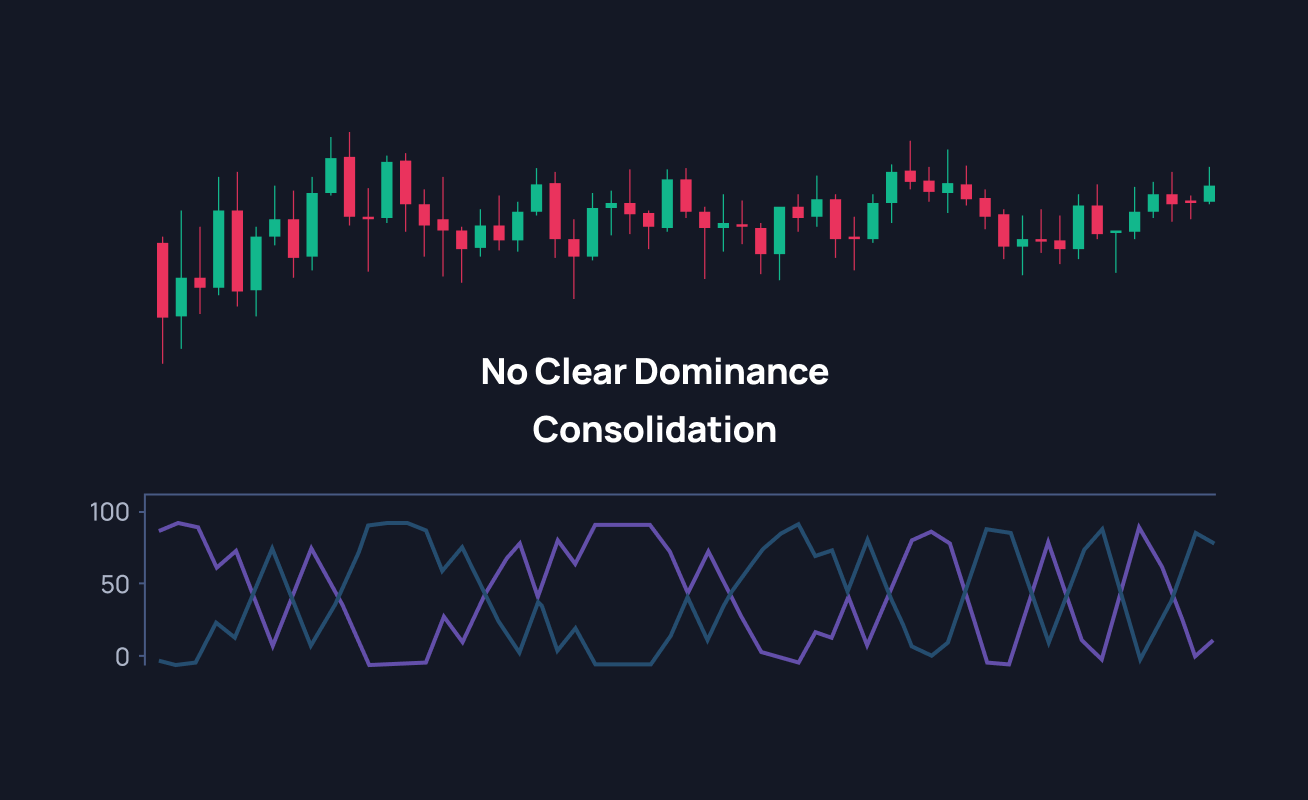
- Les deux autour de 50 : indique un marché latéral ou sans direction claire.
Contrairement à de nombreux indicateurs basés sur le prix, Aroon se concentre sur le “temps” — depuis combien de temps les derniers plus hauts et plus bas ont été formés — ce qui en fait une méthode unique pour mesurer la force d’une tendance.
Comment les traders utilisent Aroon
1. Identifier de nouvelles tendances
Lorsque Aroon Up croise Aroon Down à la hausse et reste élevé, cela indique que les acheteurs poussent régulièrement les prix vers le haut. Les traders utilisent cela comme un début de tendance haussière.
2. Identifier un affaiblissement de tendance
Lorsque les deux lignes se rapprochent de 50, cela indique une perte de momentum et une possible phase de consolidation.
3. Confirmer les retournements
Après une tendance haussière prolongée, si Aroon Down croise Aroon Up à la hausse et reste élevé, cela peut signaler un début de retournement baissier.
Forces et limites de l’indicateur Aroon
L’une des raisons pour lesquelles les traders apprécient Aroon est sa clarté. Il montre la force d’une tendance de manière simple, sans interprétation complexe. Bien utilisé, il aide à suivre la direction dominante du marché et à éviter d’entrer lorsque le momentum faiblit.
- Donne des signaux précoces sur les changements de force de tendance
- Montre clairement si le momentum augmente ou diminue
- Fonctionne sur différents timeframes (court terme et swing trading)
Cependant, l’indicateur Aroon n’est pas parfait :
- Peut générer de faux signaux en marché latéral ou volatil
- Peut accuser un léger retard après des mouvements brusques ou des retournements forts
Il fonctionne mieux lorsqu’il est combiné avec d’autres outils de confirmation, tels que :
- Moyennes mobiles : confirment la direction générale de la tendance
- ADX (Average Directional Index) : mesure la force de la tendance et filtre les signaux faibles
- RSI (Relative Strength Index) : identifie les zones de surachat et de survente
Combiner ces outils permet de déterminer si Aroon reflète une véritable force du marché ou simplement du bruit à court terme.
L’indicateur Aroon montre clairement la force d’une tendance — pas seulement sa direction, mais aussi l’énergie qu’il lui reste. En suivant le timing des plus hauts et des plus bas, il aide à identifier quand le momentum se forme, s’affaiblit ou pourrait s’inverser.
Ajoutez-le à votre boîte à outils comme un contrôle de santé de la tendance. Utilisé avec d’autres indicateurs, il peut aider à entrer plus tôt, sortir plus efficacement et trader avec plus de confiance en phase avec le rythme du marché.